The augmented reality game Pokémon Go uses geographic information system (GIS) tools, backed by huge sets of geology, vegetation and hydrology data, to enable users to catch virtual Pokémon creatures in appropriate real-life locations.
Recommended publications
- Recommendation domains for pond aquaculture (booklet)
- Recommendation domains for pond aquaculture (brief)
The augmented reality game Pokémon Go uses geographic information system (GIS) tools, backed by huge sets of geology, vegetation and hydrology data, to enable users to catch virtual Pokémon creatures in appropriate real-life locations.
It’s technology that WorldFish scientists have been using for some time to identify appropriate sites for aquaculture in developing countries.
Whereas a water source might indicate the likely presence of a Squirtle in the popular game, for WorldFish scientists that data together with other factors could influence a recommendation for siting a fish pond.
Mapping the best sites for fish farms to meet global demand
With the global population projected to reach 9.6 billion people by 2050, aquaculture production will need to almost double from 2014’s level – from 73.8 million tons per year to 140 million tons per year – in order to satisfy fish demand in 2050 (FAO 2016).
This will require an increase in the productivity of existing fish farms, and sustainable development of the sector including construction of new ponds.
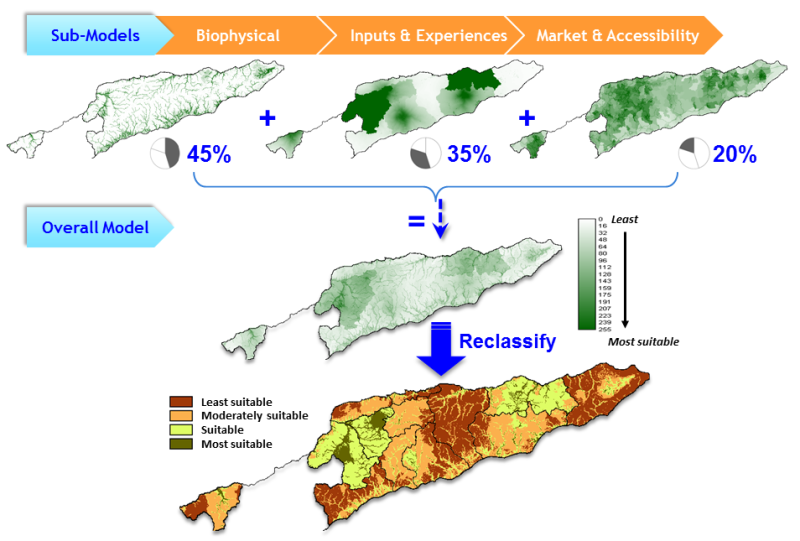
A range of biophysical and socioeconomic factors influence the suitability of a site for aquaculture. These include water availability, terrain conditions, the availability of inputs (seed and feed), access to markets and demand for fish.
For each factor, an individual indicator map is created using data from government records, NGOs and field visits, and weighted according to its relative importance. For example, water supply is a greater consideration than the location of nearby lakes.

These individual maps are then combined to create a suitability map showing the locations with the most favorable resource-base and socio-economic contexts to develop aquaculture, enabling decision makers to prioritize the ‘high potential’ areas.

Quality in, quality out
Like all GIS maps and models, it’s the input data quality that influences the output quality.
The success of Pokémon Go stems from the high accuracy of the maps featured in the game. This is thanks to users of Ingress, the predecessor to Pokémon Go launched in 2011, who helped create the data pool that determines where Pokéstops and gyms appear.
But for developing countries, where government bodies often lack resources, budget and human capacity in managing databases, reliable geospatial data is not always available.
Therefore, all suitability models produced in developing countries must be validated. This involves project staff visiting areas to confirm the physical site is indeed suitable for fish farming, and to check if households are interested in aquaculture.
This was the approach followed by WorldFish in Timor-Leste to create the country’s National Aquaculture Development Strategy (2012-2030), which highlights the areas suitable for aquaculture development.
The project, funded by FAO through RFLP and CTSP, also helped the government to setup a GIS database to monitor implementation of the strategy.
Further, staff from the Ministry of Agriculture and Fisheries were trained to collect GPS waypoints and geotag photos, helping to build staff skills and enable the sustainable tracking of aquaculture development projects.
[rev_slider pokemon]
A comprehensive tool to support decision making
Typically, GIS modeling is used in the scoping phase of a new project to determine where efforts to develop aquaculture should be concentrated.
For example, WorldFish has used this approach in Bangladesh, Sierra Leone, Malawi and Cameroon to realize the potential of aquaculture, which can improve food and nutrition security for the rural poor.
Likewise, GIS tools can highlight key constraints to the development of aquaculture in less-suited areas, enabling planners to determine and prioritize required interventions.
Using a hypothetical example, there are two locations rated “moderately suitable” but with different constraints. The first location is deficient in water resources, while the second location is constrained by poor road access. By improving road infrastructure in the second location, the site’s potential for aquaculture development would increase.
The drop in the cost of global positioning system (GPS) technologies, which pinpoint exact geographic locations for use in GIS systems, and are part of most smart phones including the cheap models often used in developing countries, is creating new opportunities for mapping.
Now government staff in developing countries, most who have access to a smart phone, can record GPS tracks using one of the many phone applications available.
This enables the easy and accurate measuring of existing and potential fish ponds, which in turn provides reliable data and information for planning, monitoring and evaluation.
So while the general public are off hunting Pidgeottos, planners and policymakers are harnessing the power of GIS tools to find the best sites for aquaculture ponds in developing countries to help meet global demand for fish.